How to construct a Visual Acuity Chart?
Before constructing a Visual Acuity Chart, we need to know and decide what kind of chart we want to construct. There are different kinds of charts for visual acuity measurement.
But based on construction they fall under two categories, Snellen and logMAR.
Visual Acuity Chart can be constructed based on 2 criteria,
- Measurement of minimum separable acuity
- Measurement of minimum recognizable acuity
The letters in the chart are called optotypes.
- PRINCIPLE of the construction:
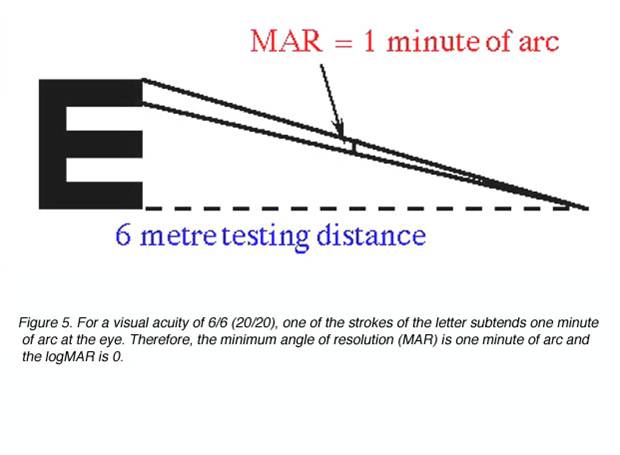
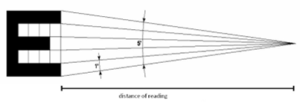
Two distinct points can only be recognized as separate when they subtend an angle of one-minute arc at the nodal point of the eye

SNELLEN CHART:
Snellen defined “standard vision” as the ability to recognize one of the optotypes when it subtends an angle of 5 minutes of arc.
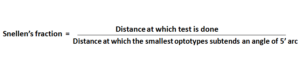
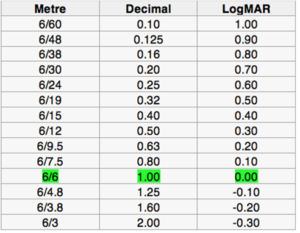
For example, 6/60 means the ability to see an object only at 6 meters which should be normally seen at 60 meters.
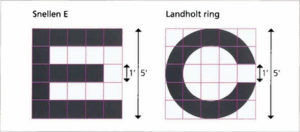
At 6 meter (20 ft), the letters on the 6/60 (or 20/20) line should subtend 5 minutes of arc (each limb of the letters subtend 1 minute of arc)
If visual acuity is 6/6 it is considered as normal visual acuity
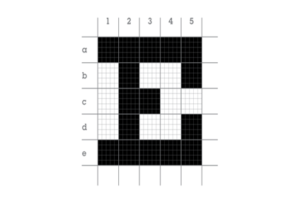
- Letters are constructed usually on a 5 x 5 grid so that the size of the critical detail (each gap width) subtends 1/5th of the overall height.
- Optotype SIZE calculation:
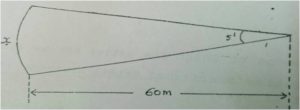
-For example, if we want to construct a 6/60 letter, then
Height: Tan 5′ = x / distance from the Optotype to the eye
(Convert minutes into degrees)
Tan (5/60) = x/60
0.00145 = x/60
x = 0.087m or 8.7 cm
So, the height of 6/60 letter suppose to be 8.7cm
Width: As it is a 5 x 5 grid (square), height = width
So, the width of 6/60 letter suppose to be 8.7 cm
The thickness of critical detail: As it is a 5 x 5 grid,
total thickness = 5 times the thickness of the critical detail.
8.7/5 = 1.74 cm.
So, the thickness of each box in the grid of 6/60 letter suppose to be 1.74cm
- In the same way, the size of other optotypes can also be constructed
- Usually, 9 lines are taken on the Snellen chart. (6/60, 6/36, 6/24, 6/18, 6/12, 6/9, 6/6, 6/5, 6,4)
- Letters should be evenly spaced on each line
- The space between two consecutive lines should be 20mm (approx)
- Snellen chart doesn’t follow any progression i.e. – Variation in several letters per line, it goes down in ascending order.
– The non-uniform decrease in size of letters from top to bottom.
- British standards selected letters of Equal Legibility (D,E,F,H,N,P,R,U,V,Z)
- Previously slab serif letters are used but now sans serif letters are used.
- Visual Acuity Chart should be evenly illuminated. AOA Standards* for chart luminance is 34-51 cd/m (10-15 foot-lamberts)
LogMAR CHART:
- Optotype size calculation is same as Snellen’s optotypes
- Usually, 14 lines are taken
- Letter separation (space between letters on each line) = letter width on that line
- Row separation (space between the rows of adjacent lines) = height of letters in a smaller row
- Letters on each successive line are “r” times larger than those of the previous line, where r is constant (r = common ratio)
– Geometric progression:
In logMAR 6/60, 6/48, 6/38…..r = 1.26
So, this chart follows a progression with an r-value of 1.26 or 0.1 log units.
By using all these principles and the below-given values, Optotype size can be calculated accordingly.
OTHER CHARTS
- The Visual Acuity Charts that follow Snellen format are tumbling E, Landolt C and regional language charts.
- The Visual Acuity Charts that follow logMAR format are ETDRS, Bailey- lovie charts, tumbling E and Landolt C.
*(Tumbling E and Landolt C are available in both formats
- The only difference between ETDRS Visual Acuity Chart and Bailey lovie is the usage of Sloan letters (C, D, H, K, N, O, R, S, V and Z) in ETDRS chart.
| Line | Snellen units | Log MAR units | ||
| No. | meter | Feet | meter | feet |
| 1 | 6/60 | 20/200 | 6/60 | 20/200 |
| 2 | 6/36 | 20/120 | 6/48 | 20/160 |
| 3 | 6/24 | 20/80 | 6/38 | 20/125 |
| 4 | 6/18 | 20/60 | 6/30 | 20/100 |
| 5 | 6/12 | 20/40 | 6/24 | 20/80 |
| 6 | 6/9 | 20/30 | 6/19 | 20/63 |
| 7 | 6/6 | 20/20 | 6/15 | 20/50 |
| 8 | 6/5 | 20/15 | 6/12 | 20/40 |
| 9 | 6/4 | 20/13 | 6/9.5 | 20/32 |
| 10 | 6/7.5 | 20/25 | ||
| 11 | 6/6 | 20/20 | ||
| 12 | 6/4.8 | 20/16 | ||
| 13 | 6/3.8 | 20/12.5 | ||
| 14 | 6/3 | 20/10 | ||
References:
Optometric instrumentation by David B. Henson
Primary care optometry by Theodore P. Grosvenor